URBAN DATA ANALYSIS & VISUALIZATION
PERCEPTA
Bring traffic and environmental information into one view. PERCEPTA turns data from ATLAS, MERMAID, and CCTV systems into insights for cities, mobility teams, and research partners.
Turn urban observations into actionable insight.
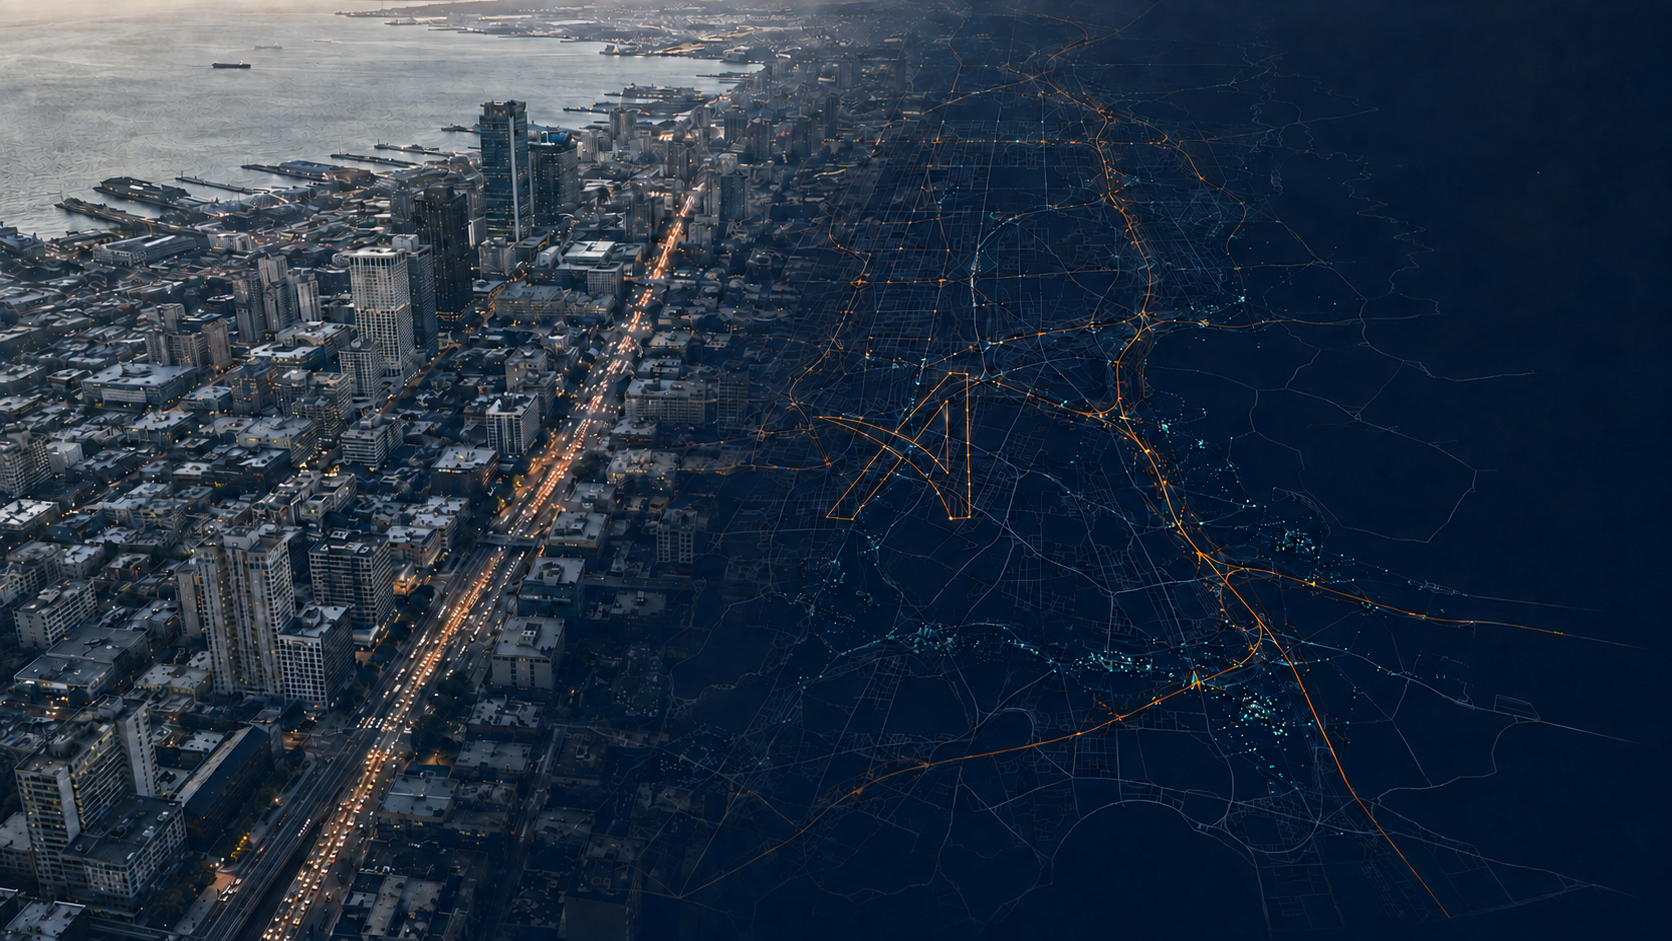
Illustrative data visualization, not a screenshot of the PERCEPTA interface.
WHAT PERCEPTA DOES
Explore movement, environmental conditions, and trends through maps, analytics, and conversational tools.
01
Explore vehicle-type trends through daily and weekly heatmaps, and view events on a map.
02
Use volume-to-capacity congestion scoring and forecasting to support traffic analysis and planning.
03
Compare mobility data with CO2, PM2.5, and noise measurements to investigate relationships.
04
Use AI chat, multilingual support, and automatic report generation to explore the data and communicate findings.
05
PERCEPTA-3D uses monocular camera recognition to bring spatial observations into a map-based view.
06
Bring ATLAS traffic intelligence, MERMAID measurements, and CCTV-derived observations into a shared analytical view.
CONNECTED BY DESIGN
ATLAS observes movement. MERMAID measures the urban environment. PERCEPTA brings their outputs together so your team can see the relationships.
ATLAS traffic intelligence
MERMAID sensing
PERCEPTA insights
EDGE COMPUTER VISION
Traffic intelligence, processed at the edge.
ENVIRONMENTAL & INFRASTRUCTURE SENSING
Connect traffic with the environment around it.
LET'S WORK TOGETHER